What the Middle East Loses Every Day War Continues
A deep dive across six compounding dimensions — economic, humanitarian, educational, commercial, and generational. Every figure cross-referenced and sourced.
The financial toll of sustained conflict in the Middle East operates at every scale — from the household to the national budget. No actor in the region is insulated. Gaza’s economic collapse is the most severe crisis UNCTAD has ever recorded in its global dataset, erasing 69 years of human development in a single year.
Beyond the immediate theater, the reverberations reach global energy markets, shipping lanes, aviation corridors, and the long-term development ambitions of the Gulf’s most ambitious sovereigns. This report maps the full architecture of that loss — dimension by dimension, actor by actor — with every figure sourced and cross-referenced.
The Economic Hemorrhage
The financial toll operates at every scale, from the household to the national budget. No actor in the region is insulated. Gaza’s collapse is the most severe economic crisis UNCTAD has ever recorded in its global dataset — erasing 69 years of human development in a single year.
| Israel | |
|---|---|
| Daily burden — Gaza war (Bank of Israel) | ~$84M / day |
| Daily cost — Iran war phase (WSJ) | ~$200M / day |
| Total war cost Oct 2023 – end 2025 | ~$68 billion |
| Budget deficit (2024) | ~7% of GDP |
| Gaza Strip | |
|---|---|
| GDP contraction 2024 vs 2023 (UNCTAD) | –83% |
| Cumulative contraction 2023–2024 | –87% |
| GDP per capita (2024) | $161 |
| Food price inflation year-on-year | +440%+ |
| Human development years erased (UNCTAD) | 69 years |
| Regional Inflation Rates | |
|---|---|
| Gaza | 140% |
| Sudan | 119% |
| Iran | 29% |
| Egypt | 21% |
| Yemen (GDP halved since 2015) | 20% |
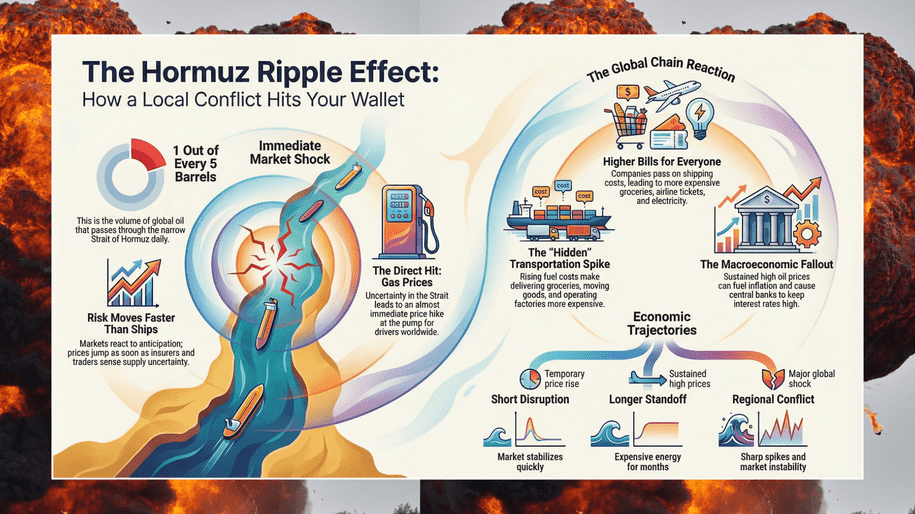
Energy, Trade & the Strait of Hormuz
Approximately 20 million barrels per day of crude oil and petroleum products move through the Strait of Hormuz, along with roughly one-fifth of global LNG trade. Over 80% of this volume is destined for Asian markets. Energy pain is exported globally while political costs accrue locally.
| Strait of Hormuz | |
|---|---|
| Daily oil and petroleum products flow | ~20M barrels |
| Share of global LNG trade | ~20% |
| Destination of 80%+ of volume | China, India, Japan, S. Korea |
| Brent crude spike — Iran–Israel war opening days | +15%, reaching $120/bbl |
| Full-closure scenario (parliament-authorized) | Could push oil to $150+ |
| Red Sea / Suez Canal | |
|---|---|
| Suez Canal traffic drop — Jan to Feb 2024 | –50% YoY |
| Container ship traffic — full year 2024 | –90% |
| Freight rates Shanghai to Rotterdam | ~80% above pre-crisis |
| Daily cargo blocked by Houthis | ~$10B / day |
| Global inflation impact if oil hits $90–$100 | +1 ppt in developed markets |
“After a decade of conflict, MENA countries lose approximately 10% of per capita GDP — and do not recover.”
— IMF, Cross-Country Analysis of Conflict and Economic PerformanceThe Human Toll
Over 72,000 Palestinians killed as of early 2025. 70% of all structures in Gaza damaged or destroyed. Reconstruction will take 16 to 80 years. These numbers are not abstractions — they are the baseline from which any future must be built.
| Gaza Strip | |
|---|---|
| Total killed as of early 2025 | 72,000+ |
| Structures damaged or destroyed (World Bank, Apr 2025) | 70%+ |
| Population food insecure | 91%+ |
| Rubble generated | 50M+ tons |
| Time to clear debris | 20–22 years |
| Reconstruction cost (UN / World Bank / EU) | $53B – $70B+ |
| Reconstruction timeline (UN estimate) | 16 to 80 years |
| Lebanon, Yemen & Region-Wide | |
|---|---|
| Lebanon killed — 2024 offensive | 3,700+ |
| Lebanon displaced | 1.3 million |
| Sudan dead — concurrent conflict | 150,000+ |
| Sudan people requiring emergency aid | 30 million |
| Region-wide internally displaced | 19 million+ |
Estimated reconstruction costs by territory:
The Education Crisis & the Lost Generation
This is the most insidious loss — invisible to commodity markets but decisive for the region’s next fifty years. These are children who may never fully recover. No reconstruction plan, however generously funded, can give them back their time.
| School Infrastructure — UNRWA Satellite Assessment, July 2025 | |
|---|---|
| Schools sustaining some level of damage | 97% |
| Facilities requiring full reconstruction or major rehabilitation | 91.8% |
| School-age children without face-to-face learning | 658,000+ |
| Human Casualties in Education — UN, October 2025 | |
|---|---|
| Students killed | 18,069 |
| Education staff killed | 780 |
| Students injured | 26,391 |
| Children sustaining life-altering injuries (Save the Children) | 15 per day |
| Learning equivalent already lost — University of Cambridge | 5 academic years |
| Additional loss if schools closed until 2027 | Up to 10 more years behind |
Tourism, Investment & the Safe-Haven Illusion
The Gulf’s defining narrative of the last decade — that stability, luxury tourism, and diversified investment were replacing oil dependence — is under acute structural threat. The perception damage will outlast the military conflict by years.
| Tourism & Investment Losses — Tourism Economics / WTTC | |
|---|---|
| Estimated hit to regional visitor spending | $34B – $56B |
| Inbound arrivals decline (prior forecast was +13%) | –11% to –27% |
| Middle East share of global international transit aviation | ~14% |
| London to Singapore economy ticket surge | +900%+ |
| Saudi Vision 2030 and UAE diversification timelines | Materially set back |
Human Capital: The Invisible Bleeding
Wars do not merely kill people. They expel the educated, the entrepreneurial, and the hopeful. Reconstruction requires human capital that is now dispersed across Egypt, Turkey, Qatar, and Europe. It cannot be imported.
| Brain Drain — Gaza | |
|---|---|
| Individuals who left Gaza (Oct 2023 – early 2025) | ~100,000 |
| Profile of departures | Skilled professionals, academics |
| Brain Drain — Israel (Jan 2023 – Sep 2024) | |
|---|---|
| Israelis who emigrated | ~90,000 |
| Profile | Hundreds of PhDs, thousands of engineers |
| Income tax revenue lost (NIS 1.5B) | ~$461 million |
| Additional uncounted losses | VAT, corporate tax, pensions |
Four Conclusions No Analyst Should Miss
The Gulf’s safe-haven brand is the highest-stakes casualty no one is pricing correctly
Saudi Arabia, the UAE, and Qatar spent decades and hundreds of billions constructing a stability narrative. Tourism Economics projects 11–27% visitor drops and $34–56 billion in spending losses — a direct assault on Vision 2030. The perception damage will outlast the military conflict by years.
Reconstruction timelines are wildly optimistic
The UN estimates rebuilding Gaza could take 16 to 80 years. Clearing rubble alone will take 20+ years. Ordnance clearance adds another decade. Every additional day of conflict extends that clock and deepens the human capital deficit that makes reconstruction viable in the first place.
The Strait of Hormuz remains the world’s most dangerous economic chokepoint
If oil reaches $90–$100 per barrel, developed-market inflation rises over 1 percentage point with corresponding global GDP cuts. A full closure — which Iran has threatened and its parliament has voted to authorize — could push oil toward $150 or beyond.
The compounding structure makes recovery exponentially harder over time
Physical infrastructure can eventually be rebuilt. Trust, institutional legitimacy, human capital, and the lost childhoods of an entire generation cannot. The IMF is unambiguous: after a decade of conflict, MENA countries lose approximately 10% of per capita GDP and do not recover.
Sources
- Bank of Israel
- UNCTAD
- UN OCHA
- UNRWA
- World Bank
- IMF
- UNICEF
- Save the Children
- University of Cambridge
- U.S. EIA
- Tourism Economics
- WTTC
- J.P. Morgan
- Moody’s
- Al Jazeera
- Reuters
- Wall Street Journal